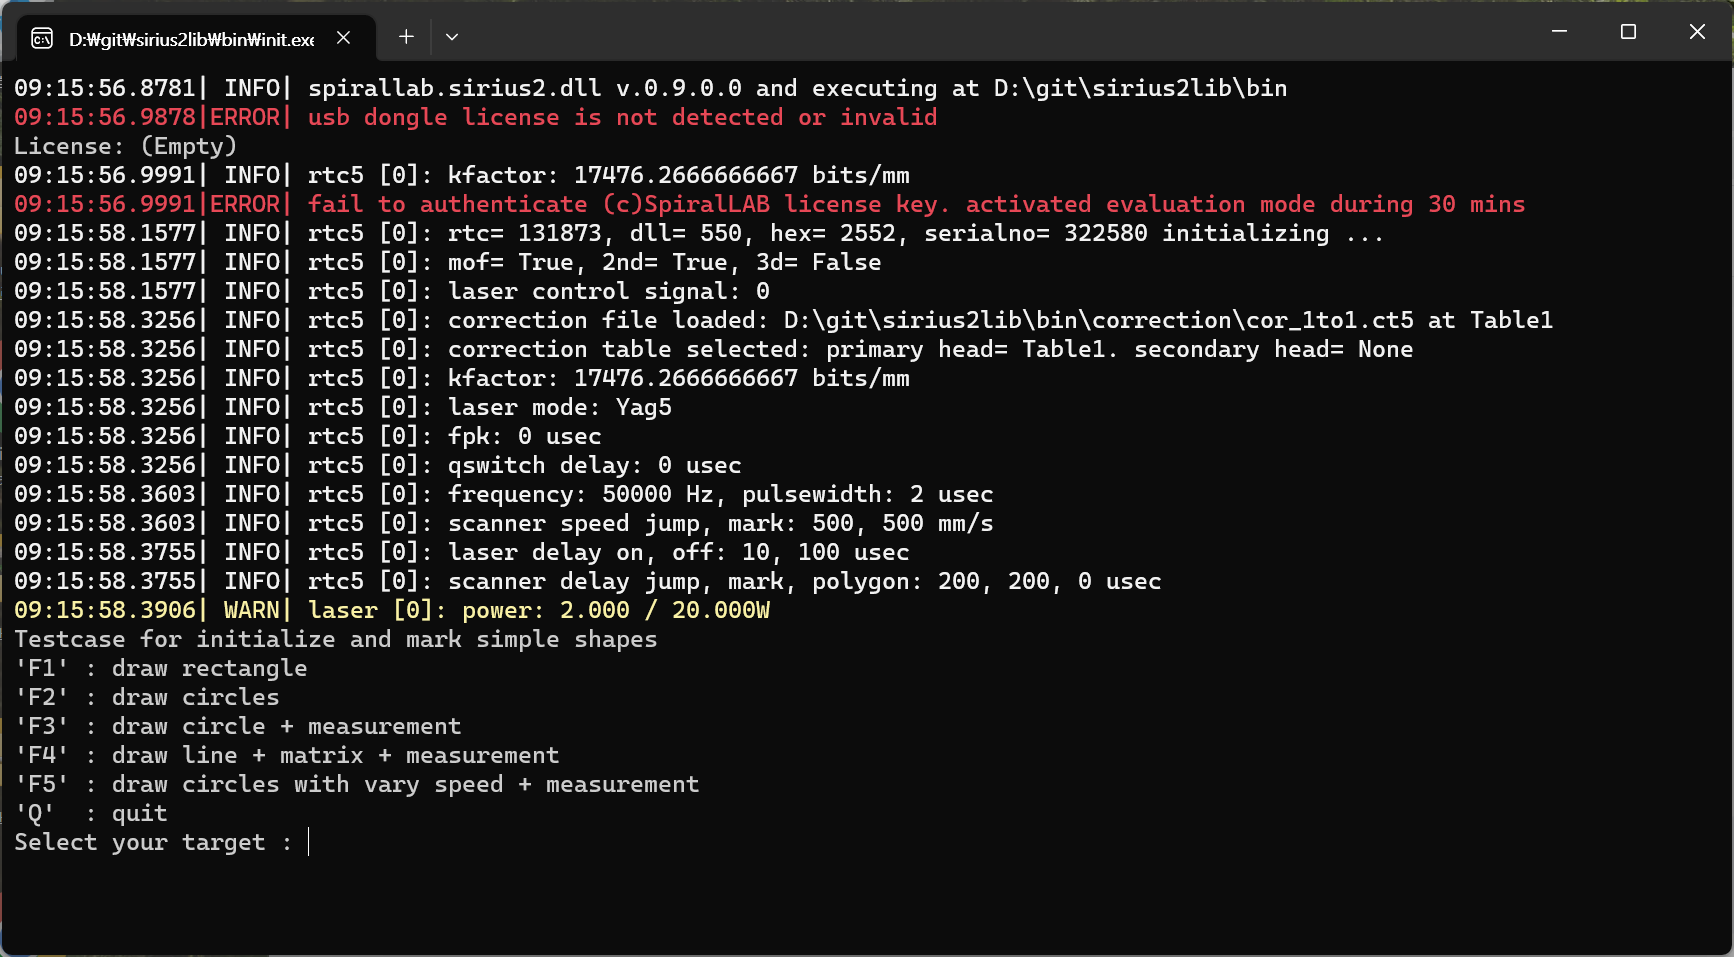
Init 데모 프로젝트는 처음 사용자가 가장 손쉽게 실행을 테스트 해 볼 수 있는 콘솔(Console) 기반의 프로그램 입니다.
시리우스2 라이브러리를 사용하기 위해서는 제일 먼저 초기화를 시도해 주시기 바랍니다.
SpiralLab.Sirius2.Core.Initialize();라이브러리 초기화 이후 스캐너 제어 장치(IRtc) 를 생성하고 초기화를 진행합니다. (참고) FOV 60mm 크기를 사용하는 RTC5 제어기의 예제
var fov = 60.0;
var kfactor = Math.Pow(2, 20) / fov;
var correctionFile = Path.Combine(Config.CorrectionPath, "cor_1to1.ct5");
var rtc = ScannerFactory.CreateRtc5(0, kfactor, LaserMode.Yag5, RtcSignalLevel.ActiveHigh, RtcSignalLevel.ActiveHigh, correctionFile);
rtc.Initialize();
rtc.CtlFrequency(50 * 1000, 2);
rtc.CtlSpeed(500, 500);
rtc.CtlDelay(10, 100, 200, 200, 0);
레이저 소스 장치(ILaser)를 생성하고 초기화를 진행합니다. (참고) 20W 레이저 소스 및 아나로그 포트 1번을 사용해 출력전압을 통한 레이저 출력 제어 예제
var laser = LaserFactory.CreateVirtualAnalog(0, 20, 1);
laser.Scanner = rtc;
success &= laser.Initialize();
success &= laser.CtlPower(2);
위의 예제에서는 출력 파워 2W 설정이므로, 실제 가공시에는 아나로그 포트 1번을 통해 1 V (= 2W/20W * 10V ) 가 출력됩니다.
자 이제 위와 같이 모두 초기화가 모두 완료되었으므로, 간단한 원(Circle) 형상을 가공을 해 봅니다. (참고) 반지름 5 mm인 원형
float radius = 5;
rtc.ListBegin(ListType.Auto);
rtc.ListJumpTo(new Vector2(radius, 0));
rtc.ListArcTo(Vector2.Zero, 360);
rtc.ListJumpTo(Vector2.Zero);
rtc.ListEnd();
rtc.ListExecute(true);
실제 지령되는(Commanded) 명령들을 계측(Measurement)하고자 한다면 다음과 같이 관심 채널로 등록하여 가공합니다. (참고) 가공이 모두 완료된 후에는 계측 결과를 gnuplot 를 통해 그래프로 출력하는 예제입니다.
var rtcMeasurement = rtc as IRtcMeasurement;
double sampleRateHz = 10 * 1000;

var channels = new MeasurementChannel[4]
{
	 MeasurementChannel.SampleX, //X commanded
	 MeasurementChannel.SampleY, //Y commanded
	 MeasurementChannel.LaserOn, //Gate signal 0/1
	 MeasurementChannel.OutputPeriod, //KHz
};
float radius = 5;


rtc.ListBegin(ListType.Auto);
rtcMeasurement.ListMeasurementBegin(sampleRateHz, channels);
rtc.ListJumpTo(new Vector2(radius, 0));
rtc.ListArcTo(Vector2.Zero, 360);
rtc.ListJumpTo(Vector2.Zero);
rtcMeasurement.ListMeasurementEnd();
rtc.ListEnd();
rtc.ListExecute(true);

var measurementFile = Path.Combine(Config.MeasurementPath, "measurement_circle.txt");
RtcMeasurementHelper.Save(measurementFile, rtcMeasurement);
RtcMeasurementHelper.Plot(measurementFile, "CIRCLE");
(참고) 계측 결과를 그래프로 출력하기 위해서는 gnuplot 프로그램이 해당 경로(“\plot\gnuplot\gnuplot.exe”) 에 미리 설치되어 있어야 합니다. gnuplot 프로그램의 다운로드 : http://tmacchant33.starfree.jp/gnuplot_bin.html
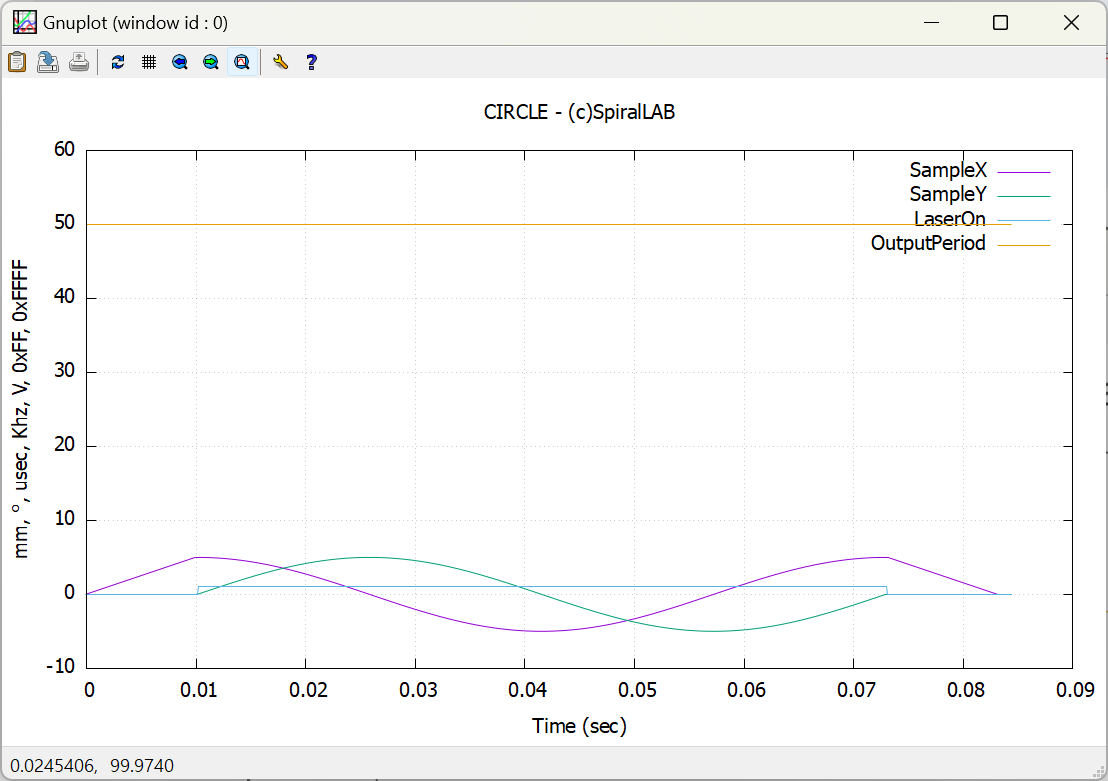
위 그래프에서 계측된 정보를 분석해 보면, 원의 시작 위치로 점프 (5,0) 후 X 축은 Cosine, Y 축은 Sine 운동을 하고 있으며, 실제 가공 부분(LaserOn)에서 설정된 펄스(50KHz )가 출력되었고, 가공이 완료된 후 원점으로 점프 (0,) 되었음을 잘 보여주고 있습니다.
프로그램 종료 시점에 사용된 자원을 반납(해제) 합니다.
rtc.Dispose();
laser.Dispose();
(참고) 시리우스2 라이브러리는 라이센스 키가 없더라도 30분간 모든 기능을 제공하고 있습니다.